
Table of Contents
- What You’ll Need Before You Start
- Step 1: Cluster Appointments by Geographic Territory
- Step 2: Implement Smart Scheduling to Minimize Travel Distance
- Step 3: Use Field Service Route Optimization Software
- Step 4: How to Track Field Employee Location in Real Time
- Step 5: Managing Travel Time for Hourly Technicians
- Common Mistakes to Avoid When Reducing Drive Time
- Frequently Asked Questions
Last Updated: September 27, 2026
What You’ll Need Before You Start
Before tackling how to reduce drive time for service technicians, map your current situation: which jobs your team handles, where they’re located, and actual travel times between appointments.
Gather basic data first:
- Your service area boundaries
- Typical job duration per appointment
- Current technician routes and travel patterns
- Customer locations and address clustering
- Peak service times and seasonal demand
Secure buy-in from your team by explaining that less windshield time means more billable hours and less fatigue.
You’ll need visibility into technician locations and queued jobs, start with spreadsheets if necessary, but plan to upgrade as you scale.
Step 1: Cluster Appointments by Geographic Territory
The most effective way to reduce drive time is grouping appointments by location. Instead of sending a technician across town for one job, then back across town for another, cluster similar geographic areas into service zones.
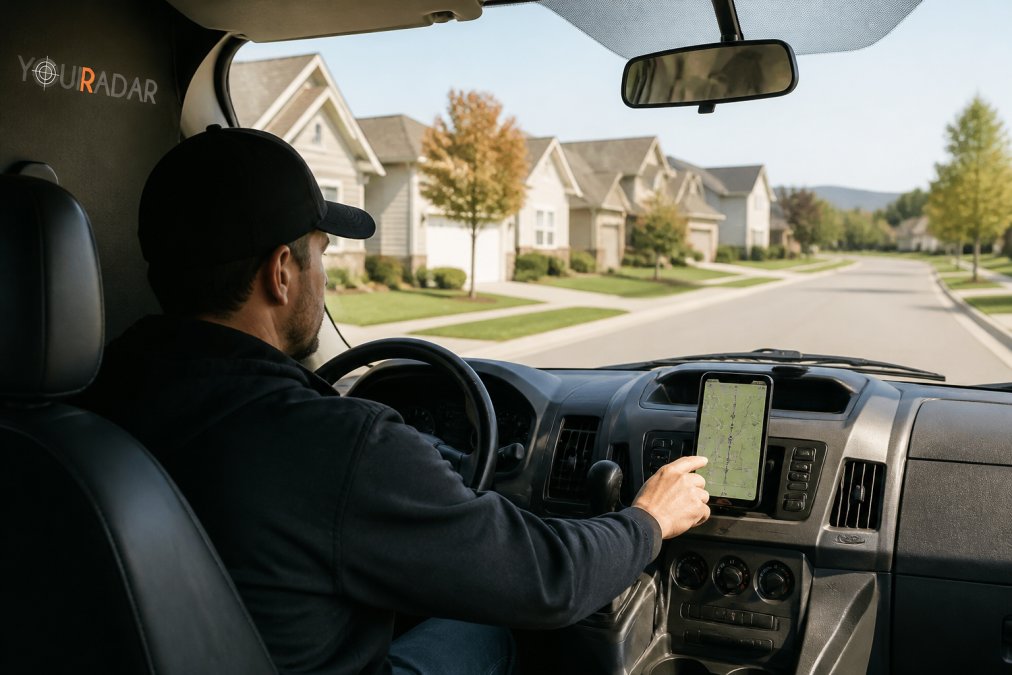
Divide your service area into territories using a simple map with colored zones, ensuring technicians handle multiple jobs within the same area.
This clustering cuts travel time significantly, a technician handling four jobs in one neighborhood spends far less time driving than handling four jobs scattered across your service area.
When clustering, consider these factors:
- Population density and job volume per zone
- Geographic boundaries that make sense for your team
- Technician skill levels and specializations
- Time of day and appointment scheduling windows
- Seasonal demand variations in different areas
Geographic clustering alone typically reduces drive time by 20-30% without software investment.
Step 2: Implement Smart Scheduling to Minimize Travel Distance
Next, implement intelligent scheduling within zones by assigning jobs in logical sequences that minimize backtracking while remaining flexible to adapt when conditions change.
Schedule appointments to create natural flow: if you have three jobs on the same street, schedule them in order from one end to the other, not back-and-forth.
Prioritize flexible appointment slots first, then fit time-specific appointments around them to maximize sequencing efficiency.
Account for realistic drive times based on traffic patterns and time of day, a two-mile job might take 5 minutes off-peak or 20 minutes during rush hour. Build buffers accordingly.
Core scheduling practices: build geographically flowing routes, group jobs by time windows, schedule flexible appointments to fill gaps, account for traffic patterns, leave buffers for delays, and batch similar job types.
Dynamic rerouting is critical. Static schedules often fall apart by mid-morning when traffic, emergencies, or delays disrupt the plan. Use real-time traffic data and mobile dispatch to reroute technicians on the fly.
When a technician finishes early or an urgent call arrives, reassign them to the nearest available job. If stuck in traffic, reroute them to a closer job to prevent wasted time.
Enable dynamic rerouting by using dispatch software with real-time traffic APIs, training dispatchers to monitor locations and conditions, setting rerouting rules (e.g., reassign if more than 15 minutes late), communicating changes via mobile app, and tracking savings.
Dynamic rerouting typically recovers 5-10% of lost time by reassigning delayed technicians to nearby jobs, keeping them productive and improving schedule adherence.
Smart scheduling compounds geographic clustering benefits by sequencing work to minimize movement within zones and adapting in real time as conditions change.
Step 3: Use Field Service Route Optimization Software
Route optimization software automates much of the work by analyzing job locations, time windows, and technician availability to create efficient routes automatically.
Software handles complexity that’s hard to manage manually, when you have 15 jobs across five technicians in three zones, software makes feasible what manual scheduling cannot.
Field service route optimization software typically offers:
- Automatic route building based on job locations
- Real-time traffic integration for accurate drive times
- Technician availability and skill matching
- Customer time window constraints
- Mobile apps for technicians to see their daily route
- Dispatch updates when jobs change or new ones arrive
YourRadar combines dispatch mapping with automated timesheet processing for visibility into technician location and time allocation.
Software investment pays for itself through reduced drive time, cutting 10 hours of driving per week equals 10 more billable hours at $100-150/hour.
Step 4: How to Track Field Employee Location in Real Time
Real-time location tracking enables better dispatch decisions and faster response to urgent jobs by showing exactly where each technician is.
A mobile app on each technician’s phone continuously reports location to your office system, allowing dispatchers to assign nearby jobs and provide accurate arrival estimates.
Real-time tracking improves customer communication by providing accurate arrival estimates based on actual location and traffic, reducing frustrated calls.
Tracking data reveals inefficiencies, if a technician consistently spends 45 minutes on jobs that should take 20 minutes, you’ve identified a training need.
Implement tracking with simple mobile interfaces, clear privacy expectations, route optimization focus (not micromanagement), efficiency rewards, and regular data review.
YourRadar’s dispatch mapping provides real-time visibility into technician locations and status, essential for smart dispatch decisions.
Step 5: Managing Travel Time for Hourly Technicians
Compensation structure affects technician buy-in: paying only for on-site time creates resistance to route optimization, while fair travel compensation motivates efficiency.
Paying technicians for all hours including travel time is ethical and aligns incentives: the business saves money through reduced drive time while technicians earn the same pay with less fatigue.
Example: reducing a technician’s 12 hours/week drive time by 25% frees 3 hours/week. At $25/hour, that’s $75/week in labor savings while the technician earns the same pay with more billable time.
Without clear communication, technicians may view tighter scheduling as “squeezing more work” rather than “working smarter,” damaging morale and retention.
Hourly pay for all time: Pay for travel, on-site, and administrative time. This removes financial penalties for driving and makes technicians willing partners. Communicate: “Better routing means less driving and more billable time.”
2. Mileage reimbursement plus hourly on-site pay. Some businesses pay technicians hourly only for time on customer sites, then reimburse mileage at a rate (e.g., $0.60 per km). This incentivizes technicians to minimize driving because they earn less per km than per hour. However, it can create perverse incentives (technicians rushing jobs to maximize billable hours). Use this model only if you have strong quality controls.
3. Blended pay with efficiency bonuses. Pay a base hourly rate for all time, then offer bonuses when the team hits efficiency targets (e.g., “If we reduce average drive time by 20%, everyone gets a $200 bonus”). This aligns incentives: the business saves money, and technicians share in the savings. Bonuses must be meaningful (at least 2-3% of annual earnings) to drive behavior change.
4. Flat-rate customer pricing with hourly technician pay. You charge customers a flat rate per job, but pay technicians hourly for all time. Every hour a technician spends driving is an hour that reduces your margin. This creates the strongest business incentive to optimize routes, but you must communicate transparently: “We’re investing in better scheduling software so you spend less time driving and more time on paying work. That helps us stay profitable and helps you earn more per hour.”
The retention impact. Technician turnover is expensive. Recruiting, hiring, and training a new technician costs $8,000-$15,000 in direct and indirect costs. If route optimization reduces drive time by 3 hours per week, that’s 156 hours per year, roughly 4 weeks of reduced fatigue. Technicians notice. They’re more likely to stay, and you avoid the cost of replacement.
Conversely, if you implement aggressive route optimization without adjusting compensation or workload, you signal that you’re extracting more value from the same pay.
Implementation best practices. When rolling out route optimization:
- Communicate the why. Explain that less windshield time means less fatigue, fewer accidents, and more time on billable work. Frame it as a benefit to the technician, not just the business.
- Involve technicians in the design. Ask them which routes make sense, where traffic is worst, and what scheduling constraints matter. They have local knowledge you don’t. Their input increases buy-in.
- Pilot with volunteers. Test new routing with technicians who are open to it. Let them experience the benefits (less driving, more billable hours, less fatigue) before rolling out company-wide.
- Adjust compensation if workload changes significantly. If you increase the number of jobs per technician per day, increase pay proportionally. Don’t cut compensation while increasing workload.
- Track and share results. Show the team how much drive time you’ve saved, how many more jobs you’re completing, and how that translates to business health. Transparency builds trust.
- Recognize efficiency gains. Celebrate technicians who consistently minimize drive time. Feature them in team meetings. Tie bonuses to efficiency metrics.
Common Mistakes to Avoid When Reducing Drive Time
Many service businesses make predictable mistakes when trying to reduce drive time. Learning from them can save you time and frustration.
Frequently Asked Questions
What is considered reasonable travel time for service technicians?
Reasonable travel time depends on your service territory and job density. Ideally, technicians should spend 60-70% of their day on billable work and 30-40% on travel and administrative tasks. If your technicians are spending more than 2-3 hours per day driving, geographic clustering and route optimization can help. Track actual drive time metrics to establish a baseline for your business.
How does automated dispatching reduce drive time?
Automated dispatch software assigns jobs based on technician location, skill level, and job sequence, eliminating manual scheduling delays and preventing technicians from traveling between distant service zones. Real-time dispatch mapping shows available technicians nearest to the next job, reducing windshield time and improving appointment density. This approach also prevents overlapping service areas and ensures technicians stay within defined territories.
Should service technicians be paid for travel time under provincial labour standards?
Provincial labour standards in Canada vary. Generally, travel time between job sites during a shift may be considered paid work time, while commute time to the first job and from the last job home is not. Check your provincial Employment Standards Act for specific requirements. Some businesses build travel time into flat-rate pricing or include it as billable hours to ensure technicians are compensated fairly while reducing unnecessary drive time.
What’s the fastest way to measure how much drive time we’re actually wasting?
Track on-site time versus total shift time for each technician over 2-4 weeks. Use GPS data or mobile timesheets to record clock-in/clock-out at each job. Calculate the ratio: (total on-site hours ÷ total shift hours) × 100. Most service businesses find 30-40% of shift time is travel. Compare this to your industry benchmark and prioritize high-waste routes first. Dispatch mapping tools automate this measurement.